Bar chart of life expectancy (2006)
Home » Academic writing task 1 sample essays & answer » Bar chart of life expectancy (2006)
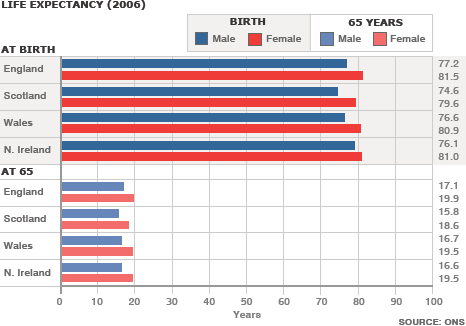
The bar chart shows the life expectancy of males and females at birth and at 65; the data is from four countries: England, Scotland, Wales and Northern Ireland.
Females from England have the highest life expectancy at birth of 81.5 years, beating women from Northern Ireland by 6 months. Females from Scotland have the lowest life expectancy of 79.6 years, meaning a gap of around 13 months between the highest and lowest. English female life expectancy at 65 is also the highest and the Scottish is also the lowest.
Regarding male life expectancy from birth, the highest is from England and reaches 77.2, almost an extra 2 years over the lowest, Scotland, at 74.6. Wales is the second lowest at 76.6 years, followed by N. Ireland at 76.1. At 65 the order is the same with England first, Wales and N. Ireland broadly similar and Scotland at the lowest with 15.8 years of life expected after 65.
In all countries observed, and at all age points, women outlive men, and regarding countries, Scotland has the lowest life expectancy while England has the highest.