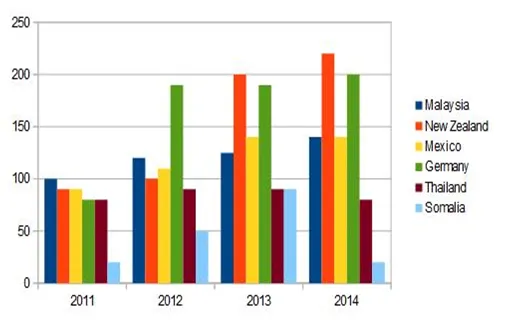
DIAGRAM 1
You should spend about 20 minutes on this task.
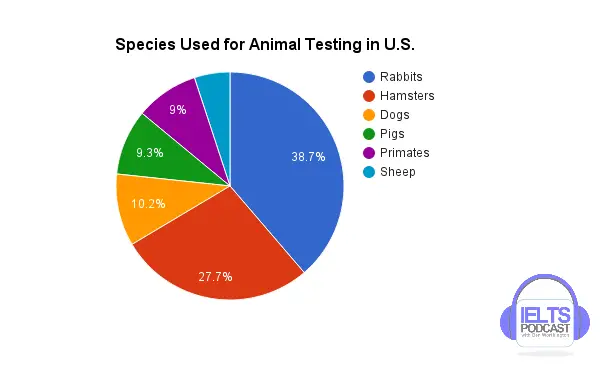
DIAGRAM 2
You should spend about 20 minutes on this task.
The chart below gives information about the percentage of cell phone users in the US from 1985 to 2010.
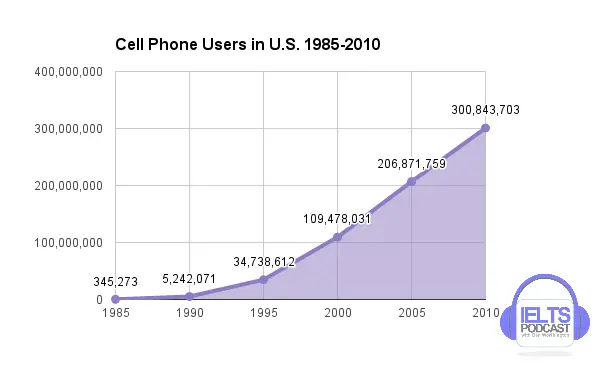
DIAGRAM 3
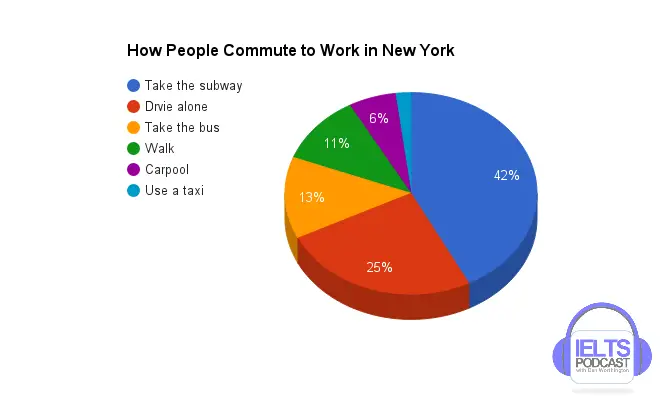
DIAGRAM 4
You should spend about 20 minutes on this task.
The chart below gives information about illicit drug users in 2012.
Summarise the information by selecting and reporting the main features, and make comparisons where relevant.
Write at least 150 words.
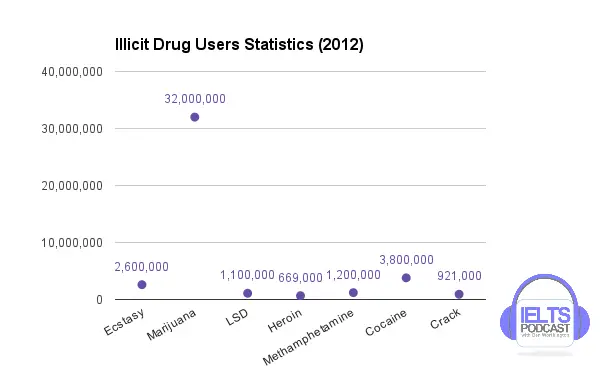
DIAGRAM 5
You should spend about 20 minutes on this task.
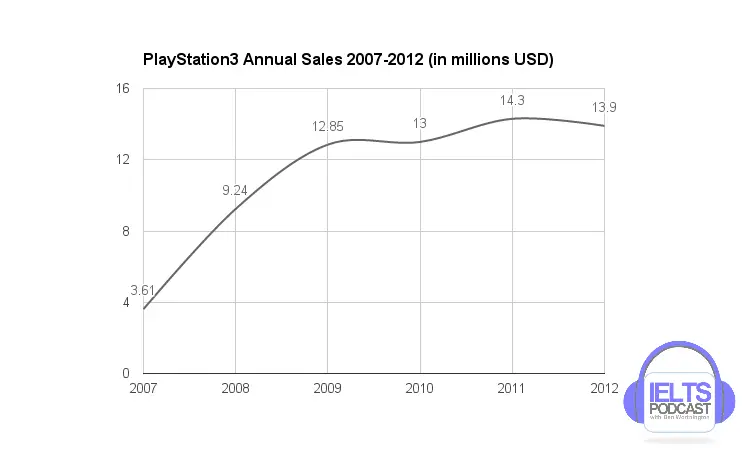
The chart below gives information about the annual sales of PlayStation 3 from 2007 to 2012.
Summarise the information by selecting and reporting the main features, and make comparisons where relevant.
Write at least 150 words.
For more IELTS Academic Task 1 Questions, click here.
DIAGRAM 6
You should spend about 20 minutes on this task.
The chart below gives information about FIFA World Cup wins count per country.
Summarise the information by selecting and reporting the main features, and make comparisons where relevant.
Write at least 150 words.
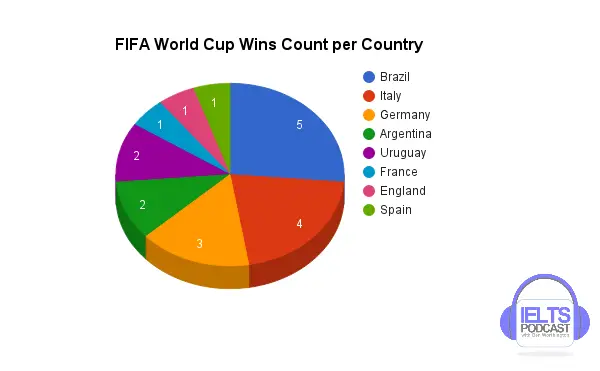
DIAGRAM 7
You should spend about 20 minutes on this task.
The chart below gives information about foreign tourists in Japan.
Summarise the information by selecting and reporting the main features, and make comparisons where relevant.
Write at least 150 words.
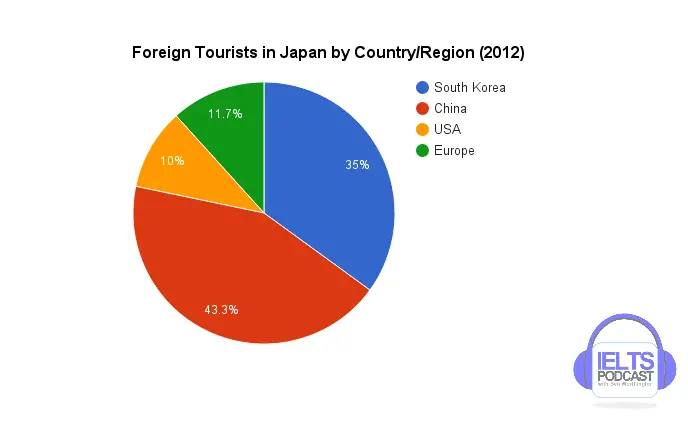
DIAGRAM 8
You should spend about 20 minutes on this task.
The chart below gives information about the inflation rate in Austria from 2010 to 2015.
Summarise the information by selecting and reporting the main features, and make comparisons where relevant.
Write at least 150 words.
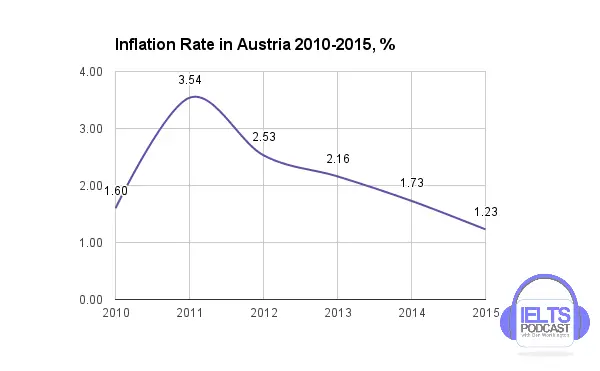
DIAGRAM 9
You should spend about 20 minutes on this task.
The chart below gives information about mobile operating system by usage.
Summarise the information by selecting and reporting the main features, and make comparisons where relevant.
Write at least 150 words.
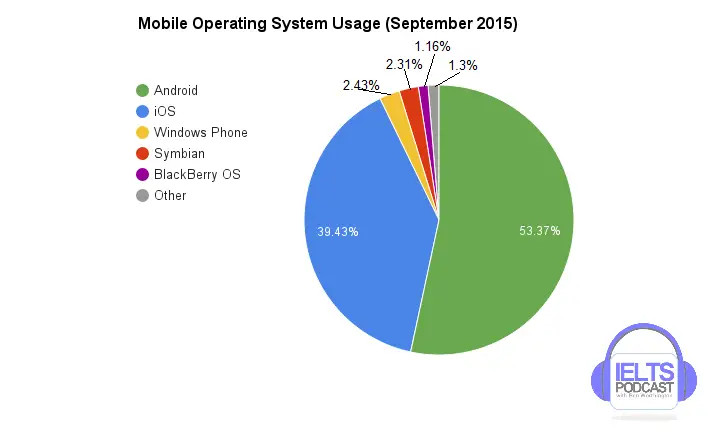
DIAGRAM 10
You should spend about 20 minutes on this task.
The chart below gives information about alcohol consumption in the UK from 1976 to 2011.
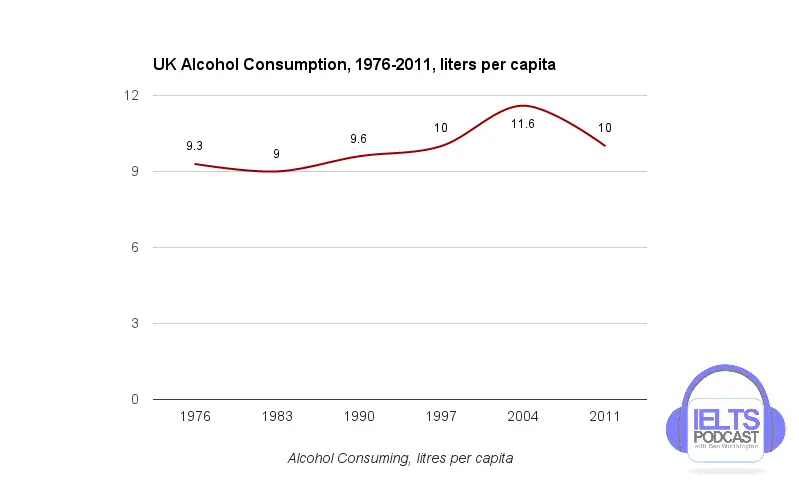
For more IELTS Academic Task 1 Questions, click here.
DIAGRAM 11
You should spend about 20 minutes on this task.
The chart below gives information about countries with the largest number of McDonald’s outlets.
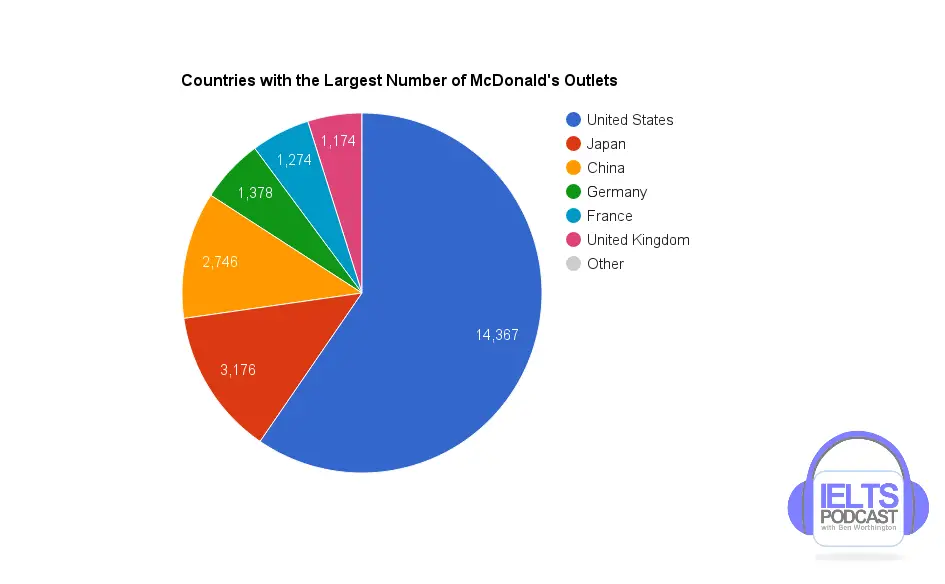
For more IELTS Academic Task 1 Questions, click here.
DIAGRAM 13
You should spend about 20 minutes on this task.
The chart below gives information about the annual net income of Facebook from 2007 to 2014.
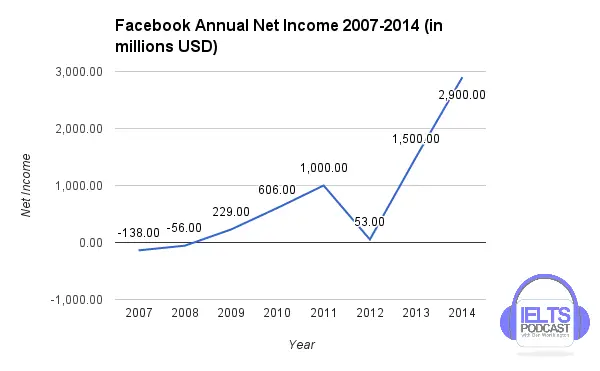
For more IELTS Academic Task 1 Questions, click here.
DIAGRAM 14
You should spend about 20 minutes on this task.
The chart below gives information about the yearly income in Germany.
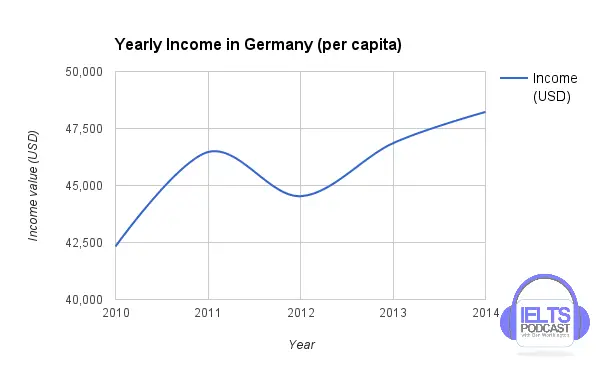
DIAGRAM 15
DIAGRAM 16
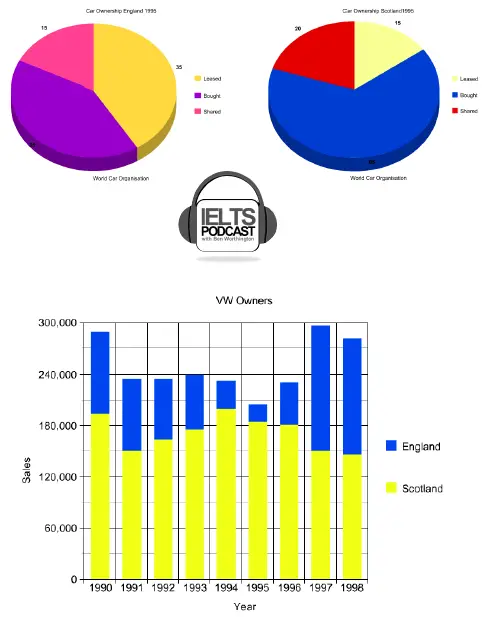
DIAGRAM 17
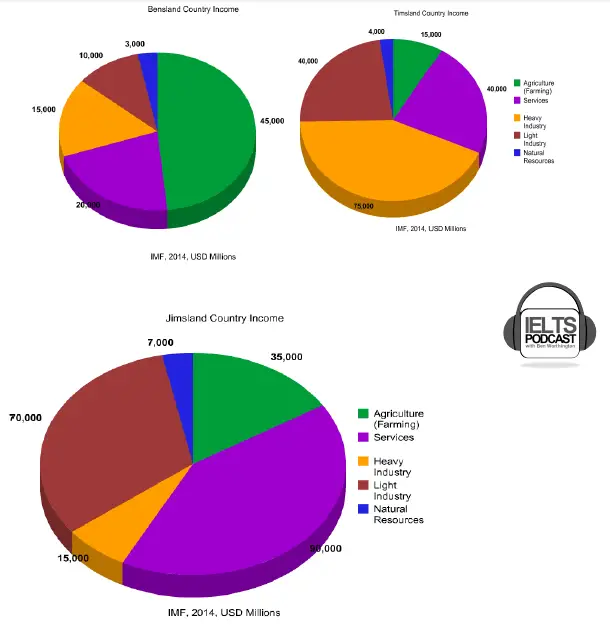
DIAGRAM 18
DIAGRAM 19
DIAGRAM 20
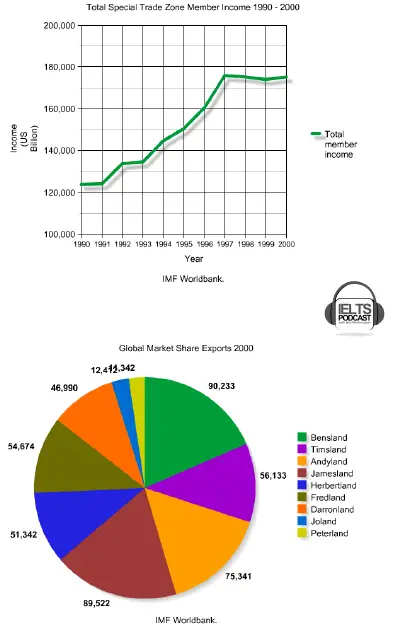
DIAGRAM 21
DIAGRAM 22
DIAGRAM 23

DIAGRAM 24
DIAGRAM 25
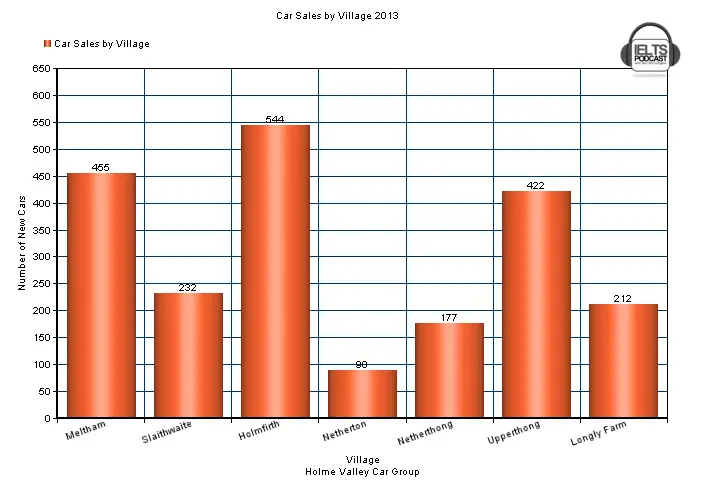
DIAGRAM 26
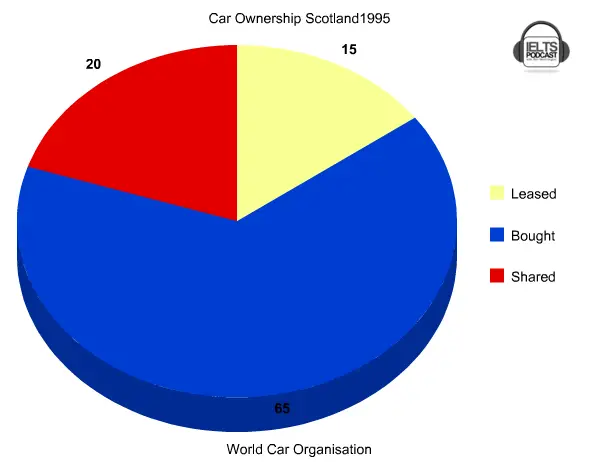
DIAGRAM 27
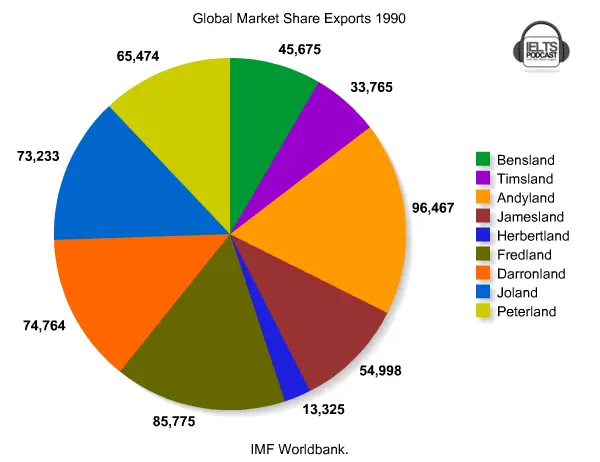
DIAGRAM 28
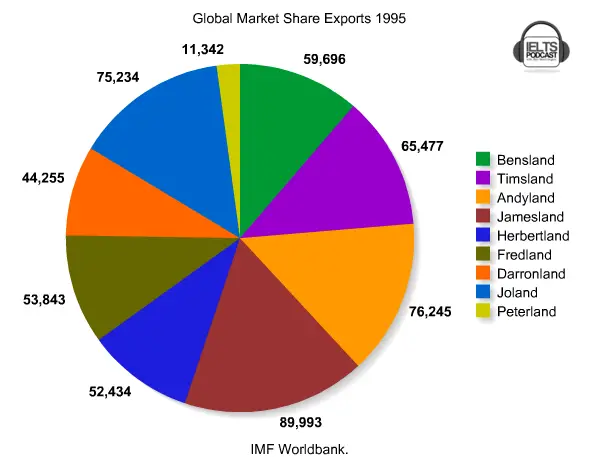
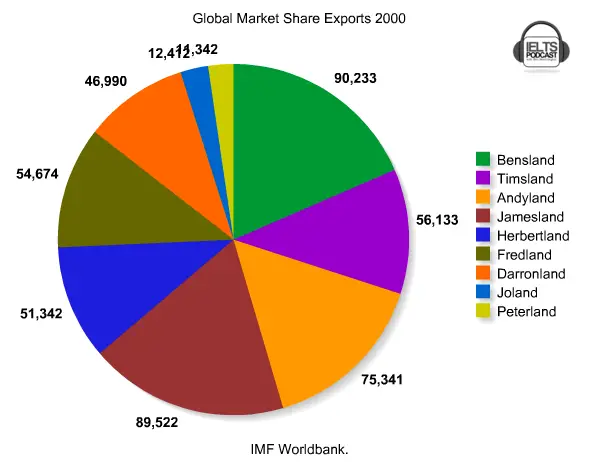
DIAGRAM 29
DIAGRAM 30
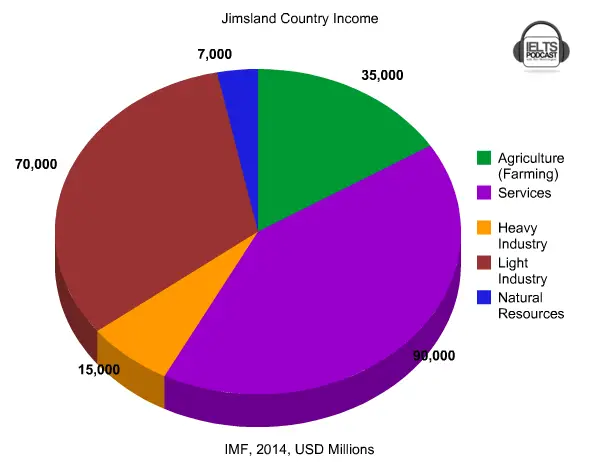
DIAGRAM 31

DIAGRAM 32
DIAGRAM 33
DIAGRAM 34
DIAGRAM 35
DIAGRAM 36
DIAGRAM 37

DIAGRAM 38
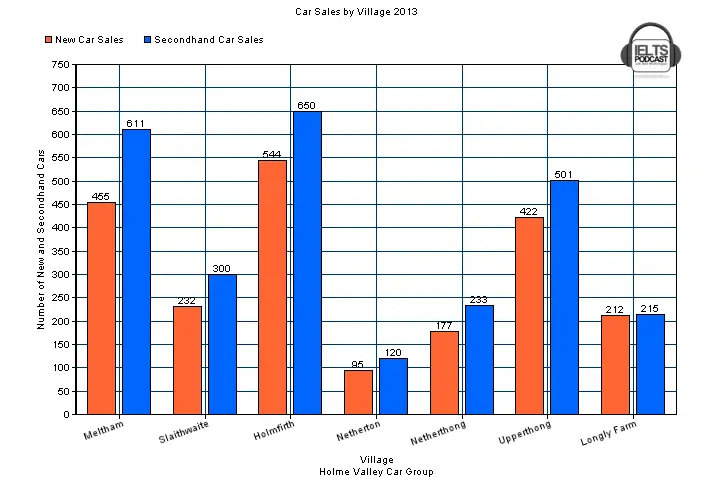
DIAGRAM 39