Task 1 writing practice
In IELTS academic task 1 you will have to describe numbers. This lesson will help you to describe those numbers using percentages in various ways that showcase your English language skills.
It is important that you know how to do this as many students who have not practised the skill repeat the numbers in the graph rather than interpreting it.
Remember this is an English language exam and the aim is to examine the extent of your vocabulary and your ability to use it adequately.
What is wrong with the answer
Below you’ll find a chart and a description of the information on it. Can you see what’s wrong with the description?
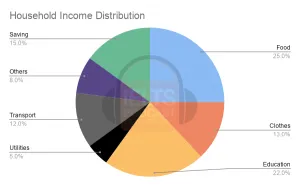
This chart shows that 25% of household income is spent on food and 22% on education. 13% is spent on clothes and 12% is spent on transport. 8% is spent on a mixture of household and personal items and 5% on power. That leaves households with just 15% to save.
I hope that you can see what is wrong with this description. It is not very exciting. It demonstrates very little of your English skill. The words “spent” and “%” run right through the paragraph and simply tell what can be seen from looking at the graph anyway.
Improving your descriptive skills
Below you’ll find four ways in which you can vary your description. To make comfortable use of them in the IELTS exam, you’ll have to practice these skills on a regular basis so that you become very familiar with them.
1. Compare sections of the pie chart
Householders spend 25% of their household income on food. This is more than five times what they spend on power and just over twice the amount spent on transport, which comes in at 12%.
There are many ways to make comparisons, so this gives you a great deal of flexibility.
Here are some comparative words that you can use
- Most
- Least
- More
- Less
- As
- Not as
2. Use fractions in place of %
It is not necessary to use percentages in the description of the graph. Fractions work just as well. So, you could say that a quarter of household income is spent on food. This is a great way to show the breadth of your vocabulary.
3. Find other words to describe the graph
So, you could say, for example, that while a quarter of the household income is spent on food each month, at 22%, only slightly less is spent on education. The smallest proportion of the household income pays for power with $5 of every $100 spent on power.
The following words should help you to become more adventurous in your descriptions of the graph.
- Proportion
- Figure
- Number/ amount
- One in five, one in ten
4. Try grouping things together and think about how you order the words
So, you could say that almost 60% of household incomes are spent on food, clothing, and education. While households spend almost as much on transport as they do on clothing. When all household expenses are paid most households can save just $15 out of every $100.
Practice
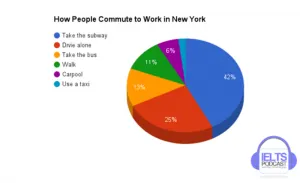
Practice makes perfect, so look at the pie chart below and try to apply the knowledge that we have mentioned above to describe how people commute to work in New York.
Audio tutorial
You can download or listen to the audio version here:
|Direct Download Here | Stitcher | iTunes | Spotify | Soundcloud | Transcript |
Podcast: Play in new window | Subscribe: RSS
More help for IELTS exam
If you need more help preparing for your IELTS writing task, have a look at the following resources:
- IELTS Writing Task 1 Vocabulary List With Examples
- How to get Band 9 in academic writing task 1- 2020
- Easy steps to writing a great academic task 1
- How to answer map questions
- Academic task 1 marking criteria
- Checklist for academic task 1
- How to describe a pie chart
- How to describe a bar graph
- Sample task 1 academic essays
- IELTS Academic Writing Task 1 Question – Pie chart showing usage