Percent of eligible voters registered for each race by state and year
Home » Academic writing task 1 sample essays & answer » Percent of eligible voters registered for each race by state and year
[NB. An official IELTS paper would use information much less political, this chart was used entirely for convenience.]
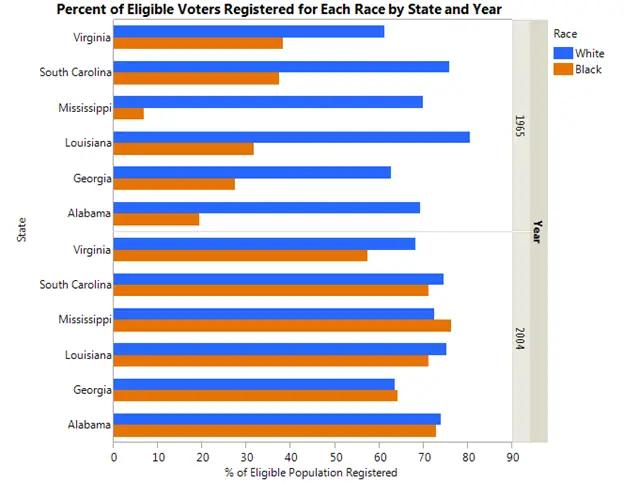
The bar chart shows the percentage of people registered as eligible voters from state to state, by race and year, in 1965 and 2004.
In 1965, clearly more eligible white voters than black were registered; the largest gap between these groups was in Mississippi, where just 7% of eligible black voters were registered and almost 80% of white voters.
The highest percentage of white registered voters was in Louisiana, followed by South Carolina. The highest percentage of black registered voters was in Virginia, at just over 40%, closely followed by South Carolina.
In 2004, the trend of more white than black registered voters continued in every state except Mississippi. Furthermore, the percentage of white voters registered fell in almost every state. The lowest percentage of black voters registered is now Virginia, at slightly under 60%, whereas the highest is 75% in Mississippi.
Overall, white voters are still in the majority in almost all states, however, over the forty year period, the trend points to a harmonising of voter numbers in each state.