Bar chart of average monthly revenue from retail telecommunication subscribers
Home » Academic writing task 1 sample essays & answer » Bar chart of average monthly revenue from retail telecommunication subscribers
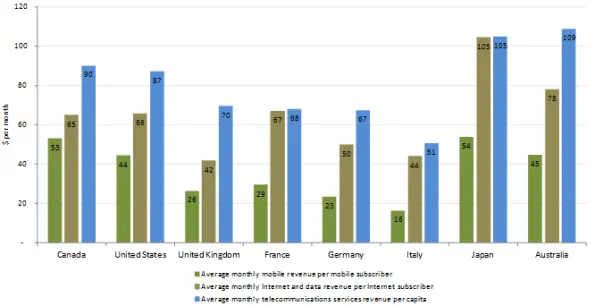
The bar chart shows the average monthly revenue from retail telecommunication subscribers from eight countries in North America, Europe, Asia and Oceania. Each country is represented by three bars: green for mobile, brown for data, and blue for services.
In practically all cases, services represent the highest revenue source per client, followed by data and lastly mobile. Australia has the highest revenue per customer for services at $109, however overall Japan has the highest revenue per customer because data and mobile revenues are considerably higher than in the other countries.
Italy has the lowest revenue figures overall, with mobile revenue at $16, data at $44, and services at $51. The North American figures are broadly similar, both countries reach around $90 for services, $65 for data and between $53-$44 for mobile. The UK, Germany and France have similar figures except France has the highest data revenue for the European countries.
The lowest revenue figures are found in Europe, the highest are in Asia, namely Japan, while North American revenue numbers are in the middle.