IELTS academic task 1 sample essay 8: temperature calibration data
Home » Academic writing task 1 sample essays & answer » IELTS academic task 1 sample essay 8: temperature calibration data
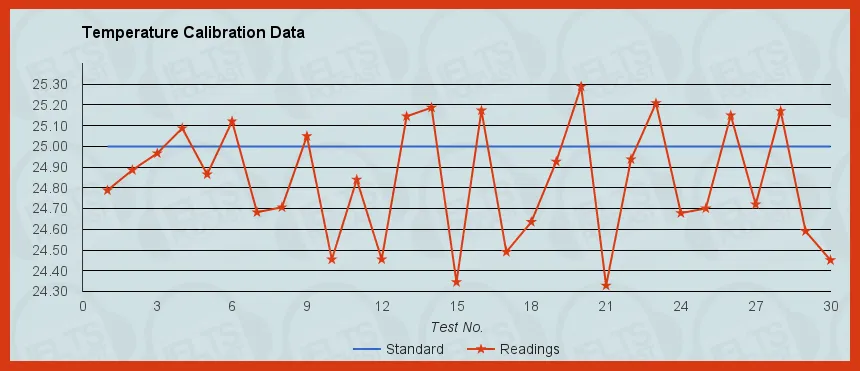
The line graph above depicts the results of 30 temperature calibration tests. The readings are measured to one-tenth of a degree, against a standard of 25 degrees.
The closest test result to the standard is the third result, which is less than one-tenth of a degree below the standard. The furthest reading from the standard came in Test No. 21, when the device registered just over 24.30 degrees. Out of 30 readings, 20 read temperatures below the standard. Only 10 tests registered readings above 25 degrees.
Across the tests, a spread of a full degree was seen between the highest and lowest results. Substantial fluctuations were seen between almost every consecutive test, with a few exceptions.
None of the readings were completely accurately with respect to the standard, and then device exhibited a tendency to register lower-than-standard temperatures, rather than higher. In fact, the most accuracy and least fluctuation occurred in the early tests.
(154 words)