How to use and write numbers for describing a graph in IELTS
The IELTS writing tasks will present you with different challenges to test your skills in writing in English for the IELTS exam. Among these challenges are some that will be presented as graphs. Read through our tutorial on how to describe a graph.
Here we will present you with 5 easy ways to begin your descriptions for those parts.
I. The use of a number.
You can begin writing about graphs by describing one part of the graph using a number. Here you can use the actual number given in the chart or you can use the percentage covered by the part you wish to describe.
Let’s look at some examples given the chart below: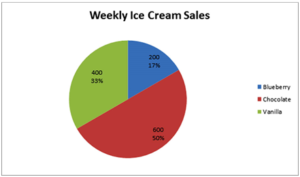
Using the actual number or value given:
Ex.
· 200 units of the ice cream sold weekly are blueberry flavored.
· 400 of the ice cream cups sold in the school were vanilla flavored.
· 600 units of chocolate flavoured ice cream were sold.
2. Using percentages
Ex.
· 50% of all ice cream sold were chocolate flavored.
· 33% of the ice cream sales were the vanilla flavored option.
· 17% of the school’s ice cream cup sales represented those flavored blueberry. Based on this data, the school should order this flavor the least for the following weeks, as it does not seem as popular with students, as the chocolate flavored one.
3. The use of phrases that begin with the article “A”.
You can use phrases that show or present an idea of some amount or portion in discussing charts. Some of the phrases you could use are:
a small number a huge number a minority
a large group a small group a majority
Let’s look at some examples given the chart below:
You can say:
· A small group shows to have taken interest in studying German, as well as, Spanish.
· A minority is shown to represent those studying German, Spanish and French.
· According to the Eurostat survey a very large number choose to study English. In fact, this number is larger than putting all the other top three languages together.
4. The use of phrases beginning with the preposition “Of”: “Of” can mean “taken from”
One of the ways to begin your essay on a given chart is by using phrases that begin with the preposition “of”.
“Of” in the phrases can be used to mean two different things:
“Of” can mean “taken from”, such as in phrases like:
Of the research made
Of the data gathered
Of the observation made
Let’s look at some examples using the same chart on the Languages Most Studied:
Ex.
· Of the survey conducted by Eurostat in 2015, English is the number one language studied in the world.
· Of the research made, people who studied English, at 94%, far outnumbered those who studied other languages, the next being only 23% which is French.
Let’s look at some examples using the chart on the ice cream sales:
Ex.
· Of the data gathered, chocolate shows as the best-selling flavor in the school.
· Of the totals derived, vanilla shows as the second most popular flavor to the students.
5. The use of phrases beginning with the preposition “Oo”: “Of” can mean “out of the”
“Of” can mean “out of the”, such as in phrases like:
Of the participants in the survey
Of the total number of…
Of the initial attendants...
Let’s look at some examples again using the Languages Most Studied chart :
Ex.
· Of the total participants in the survey conducted by Eurostat in 2015, 94% study English.
· Of all the languages in the world, the most popular is English.
Let’s look at some examples using the chart on the ice cream sales:
Ex.
· Of the total number of ice cream cups sold, 400 of them were vanilla.
· Of all the flavors of ice cream sold, chocolate is no doubt the best-seller.
So there you have it, 5 great ways to begin your IELTS writing tasks on graphs. You need a little patience, in discussing charts.
You don’t need to look at the graph and analyze it immediately, as a whole. You need to look at it in parts first, and use the 5 tips we mentioned here as your guide.
Then later, you can move on to discussing the chart as a whole.
But again, knowing the tips we gave will not be enough.
You will need to practice as often as you can, daily if possible. If you do, you’ll find that these types of writing tasks won’t be such a challenge to you anymore.
For more practice, take a look at the IELTS task 1 sample essays and make use of our essay correction service to help you improve with great feedback!
Audio tutorial
You can download or listen to the audio version here:
|Direct Download Here | Stitcher | iTunes | Spotify
More useful IELTS Academic Task 1 lessons:
- How to describe a pie chart
- Bar Chart IELTS
- How to describe a map
- Describe an image
- Describe a natural process
- How to describe a table
- How to paraphrase
- Line graph sample answer
- Marking criteria for Task 1
- Map vocabulary for IELTS Task 1
- How to describe a flow chart
- Essential skills for Task 1
- How to get band 9 for academic task 1
- How to describe a process diagram